When Rhetoric Becomes an Asset Class
Geopolitical risk is not new to global markets. Yet the 2026 United States-Iran conflict has introduced a novel challenge for investors: how to price a conflict where the primary source of volatility is not military action, but presidential rhetoric. Since late March 2026, Donald Trump has declared an imminent peace deal with Iran on at least 38 occasions. Despite these repeated assurances, military escalations have continued. The result is a persistent “see-saw” effect that has tested the resilience of trading models and the patience of institutional investors.
This article examines how senior decision-makers can apply quantitative frameworks to separate signal from noise. It argues that the traditional tools of geopolitical analysis are insufficient in an era where social media posts can move oil prices by double digits within hours. Instead, a structured approach—one that distinguishes headline sentiment from physical reality—is now essential for risk management and capital allocation.
The Anatomy of a False Peace
A Timeline of Claims and Consequences
The pattern that emerged during the 2026 conflict is both striking and repeatable. On each occasion that President Trump announced progress toward a settlement, markets reacted with optimism. Yet these reactions were frequently reversed when the physical reality on the ground failed to align with the political narrative.
In late March 2026, Trump claimed that Iran had accepted a “15-point proposal” and that the conflict would not endure. Iran publicly rejected the offer. Oil prices fell briefly, then surged. Equity markets followed the opposite trajectory.
By early April, the tone shifted. Impatient with diplomatic delays, Trump threatened to bomb Iran “to the stone age.” Strikes intensified. The United Nations warned of a full-scale war. Crude oil reached a four-year high of $115 per barrel. The S&P 500 declined by 2%.
A temporary pause arrived on 7–8 April. Trump announced a two-week ceasefire and declared “100% victory.” The S&P 500 rose by 2.5%. Oil plummeted by 16%—its largest single drop since 2020. Yet the pause was just that: temporary.
From mid-April through May, Trump repeatedly posted that a final deal was “days away.” In response, Iran permanently closed the Strait of Hormuz. Oil crossed $100 per barrel. US gasoline prices exceeded $4 per gallon. Inflationary pressures mounted.
In early June, Trump called off planned strikes at the last moment. He announced a “great settlement.” Retaliatory drone strikes followed almost immediately after an Apache helicopter was shot down. Stocks rallied by 2% on hope. Oil fell, then rebounded as friction persisted.
As of 15 June 2026, Trump has announced on Truth Social that the deal is “now complete.” Mediators confirm that a memorandum is scheduled for signing on 19 June. Global equities are surging—Nasdaq futures are up 3%. West Texas Intermediate crude has tumbled by 6% to $80 per barrel.
The lesson is clear. Each announcement generated a measurable market response. Yet the cumulative effect has been a degradation of trust. Traders now discount presidential claims. The “boy who cried wolf” dynamic has become a structural feature of this market.

Building a Quantitative Model: Three Layers of Analysis
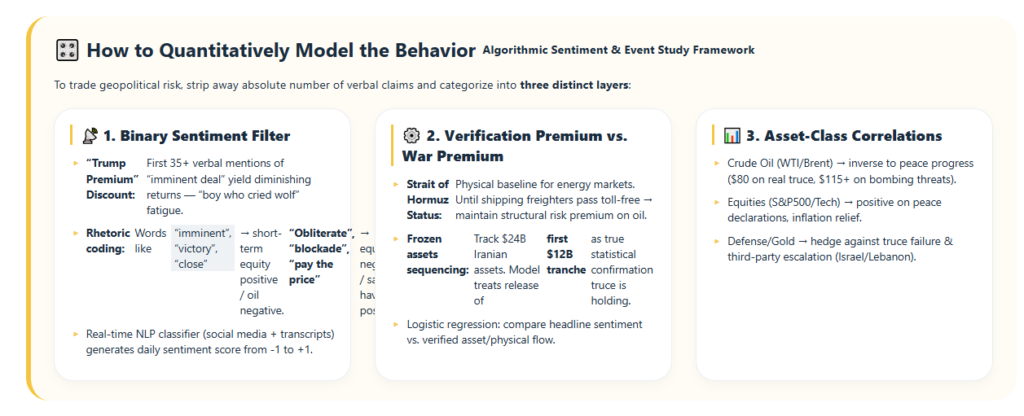
To trade or model this geopolitical risk effectively, investors must move beyond counting headlines. The following framework separates noise from substance through three analytical layers.
Layer One: The Binary Sentiment Filter
The first task is to code rhetoric rather than consume it. Social media posts containing words such as “imminent,” “close,” or “victory” have historically functioned as short-term equity positive and oil negative signals. Conversely, language such as “obliterate,” “blockade,” or “pay the price” correlates with equity declines and safe-haven inflows.
However, a critical caveat applies. The first 35+ verbal mentions of an imminent deal produced diminishing market returns. In other words, the “Trump Premium” has become a “Trump Discount.” Each successive claim carries less weight. Therefore, the model must weight recent claims more lightly than earlier ones. Sentiment fatigue is a quantifiable phenomenon.
Layer Two: The Verification Premium Versus the War Premium
A political headline is not physical infrastructure. The model must therefore track two operational metrics that serve as ground truth.
First, monitor the Strait of Hormuz. This waterway is the true baseline for energy markets. Until commercial shipping passes through toll-free and without incident, a structural risk premium on oil remains justified. No memorandum, however well-worded, alters this calculation.
Second, track the physical movement of frozen assets. Approximately $24 billion in Iranian assets remain frozen. The model should treat the release of the first $12 billion tranche as statistical confirmation that the truce is durable. Capital flows are harder to fake than press releases.
Layer Three: Asset-Class Correlation Mapping
Different asset classes respond to geopolitical signals with varying sensitivity. The model must account for these distinctions.
Crude oil, whether WTI or Brent, is highly reactive. It moves inversely to peace announcements, dropping toward $80 on credible progress. Conversely, it surges exponentially toward $115 or higher in response to active bombing threats. The asymmetry matters: upside risk is structurally larger than downside reward.
Equities, particularly the S&P 500 and technology indices, respond positively to peace declarations. The mechanism is straightforward: reduced inflation fears lower the expected path of interest rates. This benefits duration-sensitive sectors.
Defence sectors and safe havens play a counterbalancing role. Aerospace equities and gold price in the risk that the truce fails. Third-party escalation—whether from Israel, Lebanon, or non-state actors—remains a persistent tail risk that headline-driven models often overlook.
Why This Matters Now: The New Geopolitical Trading Environment
The Trump-Iran conflict is not an isolated case. It represents a broader shift in how geopolitical risk is transmitted to markets. Three structural forces make this framework relevant beyond the current crisis.
First, social media has compressed the information cycle. A single post can alter market positioning before traditional news outlets have verified the claim. This rewards speed but punishes accuracy. Investors who rely solely on headline aggregation are at a structural disadvantage.
Second, the fragmentation of global media means that different investor cohorts receive different signals. What reads as a definitive statement in one market may be treated as speculative in another. Cross-border capital flows amplify these divergences.
Third, the erosion of institutional trust has changed how markets process political communication. Central banks, governments, and international organisations no longer enjoy the default credibility they once held. Verification has replaced authority as the standard of proof.
For Nordic investors and institutions, these dynamics carry particular weight. The region’s pension funds, sovereign wealth vehicles, and energy-intensive industries are deeply exposed to oil price volatility. Moreover, Nordic markets have historically placed a premium on transparency and governance. The gap between political rhetoric and physical reality is therefore not merely a trading problem—it is a governance problem.
Nordic and International Context: Lessons from Comparative Markets
The challenge of pricing political noise is not unique to the United States. European markets have faced similar dynamics during Brexit negotiations, where repeated “final” deadlines proved anything but. Asian markets have navigated comparable volatility during US-China trade disputes, where tariff announcements and postponements created whipsaw conditions.
What distinguishes the 2026 Iran conflict is the frequency and intensity of the rhetoric. No previous episode has featured 38+ claims of imminent resolution within a three-month window. This has created a new category of risk: not geopolitical uncertainty per se, but geopolitical noise—a sustained signal that overwhelms rather than informs.
For Nordic policymakers, the implication is clear. Energy security strategies must be robust to rhetorical volatility. Diversification of supply, strategic reserves, and demand-side flexibility are not optional. They are essential hedges against a world where political communication has become a tradable asset class.
Forward-Looking Risks and Opportunities
Looking ahead, several scenarios deserve attention.
If the 19 June memorandum is signed and implemented, oil prices could stabilise in the $75–$85 range. Equity markets would likely extend their rally, particularly in Europe and Asia, where energy import costs weigh heavily on corporate margins. Inflation expectations would ease, potentially altering the trajectory of monetary policy.
However, the risks to this baseline are substantial. The truce could fail if hardliners in either Tehran or Washington derail the process. Third-party actors—Israel, Lebanese militias, or Iranian proxies—could escalate independently. The Strait of Hormuz could remain closed despite diplomatic agreements, if local commanders refuse to comply.
For investors, the optimal strategy is not to predict the outcome but to structure positions that are robust to multiple scenarios. This means maintaining hedges even during periods of apparent calm. It means weighting physical indicators more heavily than political statements. And it means recognising that in this environment, patience is itself a source of alpha.
Conclusion: From Noise to Signal
The 2026 US-Iran conflict has tested the limits of traditional geopolitical analysis. It has demonstrated that in an era of instantaneous communication and eroded institutional trust, markets must develop new tools to distinguish signal from noise.
The framework presented here—binary sentiment filtering, verification metrics, and asset-class correlation mapping—is not a panacea. It is a starting point. Its value lies in forcing discipline onto a process that is otherwise vulnerable to emotional reaction and cognitive bias.
For senior executives, investors, and policymakers, the broader lesson is this: geopolitical risk is no longer an external variable to be monitored. It is an active, tradable force that demands integration into capital allocation, strategic planning, and risk management. Those who master this integration will be better positioned to navigate the volatility that lies ahead.
Editorial Outlook
The Next Frontier: Algorithmic Geopolitics and the Automation of Risk
The framework described in this article is fundamentally manual. It relies on human judgment to code rhetoric, verify physical indicators, and weight asset-class responses. Yet the speed of modern markets suggests that automation is inevitable. A follow-up article should explore how machine learning and natural language processing are being deployed to model political communication in real time. Which firms are leading this transition? What are the regulatory implications? And how will the automation of geopolitical analysis reshape the competitive landscape for institutional investors? Nordic Business Journal invites contributions and data partnerships on this emerging frontier.
Connect with Nordic Business Journal
Nordic Business Journal is committed to delivering analytical depth and strategic foresight for senior decision-makers across the Nordic region and beyond. We welcome engagement from executives, investors, policymakers, and entrepreneurs who seek to deepen their understanding of global markets, innovation, and governance.
For editorial inquiries, partnership opportunities, or to contribute to our ongoing coverage of geopolitical risk and capital markets, please contact our editorial team. Follow us for further insights, exclusive briefings, and invitations to executive roundtables.
References
1. Bloomberg L.P. (2026). WTI Crude Oil Price Data, March–June 2026. Market data accessed via Bloomberg Terminal.
2. S&P Dow Jones Indices. (2026). S&P 500 Index Performance, Q2 2026. Historical price data.
3. United Nations Security Council. (2026). Briefing on the Situation in the Persian Gulf, April 2026. Official records.
4. Reuters. (2026). Iran Rejects US 15-Point Proposal, Late March 2026. News archive.
5. Financial Times. (2026). Oil Surges to Four-Year High on Escalation Fears, 2 April 2026. Market analysis.
6. The Economist. (2026). The Strait of Hormuz and Global Energy Security, May 2026. Special report.
7. Truth Social. (2026). @realDonaldTrump posts on Iran peace deal, 14–15 June 2026. Social media archive.
8. Nasdaq, Inc. (2026). Nasdaq-100 Futures, Pre-Market Data, 15 June 2026. Real-time market data.
9. International Energy Agency. (2026). Oil Market Report, June 2026. Monthly statistical bulletin.
10. Peterson Institute for International Economics. (2026). Frozen Iranian Assets and Sanctions Architecture, 2026. Policy brief.